In this tutorial, you will learn to install Blackbox Exporter on CentOS/RHEL and understand how to use it with Prometheus and Grafana to monitor website performance and uptime.
Prerequisites
Prometheus and Grafana must be pre-installed. Follow this article to install Prometheus and Grafana.
Blackbox Exporter Installation
Let me show you how to install Blackbox exporter first.
Step 1: Download Blackbox Exporter
Go to the official page to download the latest Linux AMD Blackbox exporter package. I am downloading the blackbox_exporter-0.16.0.linux-amd64.tar.gz file.
Transfer the downloaded file to the serverExtract files from the package.
Check all the files inside Blackbox exporter. Two files blackbox_exporter and blackbox.yml are important here.
blackbox_exporter: This is an executable file for running the service.blackbox.yml: A YAML file with all the backbox exporter configurations which you define all the endpoints to probe and modules to run.
Below command will give you all the flags you can use with Blackbox exporter.
Step 2: Create User for Blackbox
This is optional. You may either create a new user to run Blackbox or use existing Prometheus users to run it. Provide permissions and assign ownership of all its files to the new user.
Step 3: Configure Blackbox Service
It is time to configure Blackbox Exporter as a service inside systemd. Create a file blackbox.service and put the lines mentioned below in the file and save it. Don’t forget to change the path to the actual where you have extracted it.
Step 4: Start Blackbox Exporter
Run the commands below to start the Blackbox exporter as a service. Great! Blackbox exporter has successfully started. At http://localhost:9115/ you can find Blackbox Exporter running.
Integrating Blackbox with Prometheus
Let’s integrate Blackbox Exporter with Prometheus to start scraping the metrics.
Add a blackbox job with below configurations inside the prometheus.yml file. I am going to monitor the performance of https://www.telegraph.co.uk.
Restart Prometheus.
When you check the targets at http://localhost:9090/targets again, you will find a blackbox job running with the endpoint I defined.
Click on the Graph and run the query – probe_http_duration_seconds.
A visualization will get created on the data being monitored by Prometheus.
Now it is time to visualize the Blackbox job on Grafana. There are many ways to get it started, but one of the quickest would be to start with a ready-made dashboard – Prometheus Blackbox Exporter.
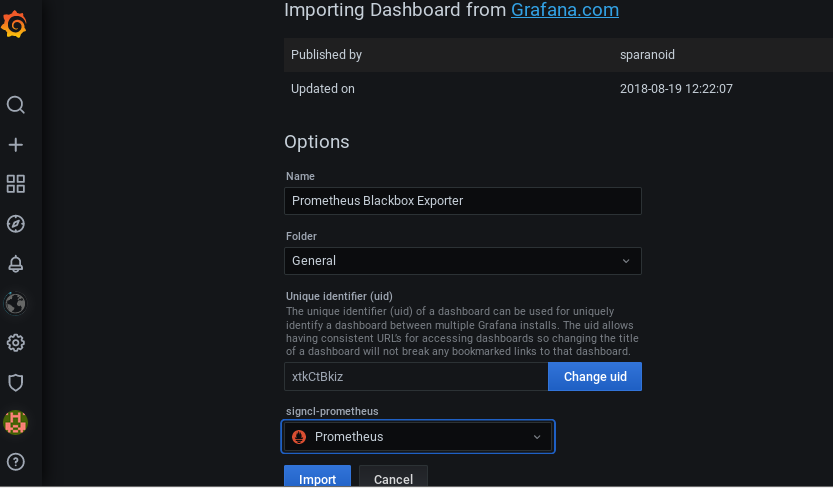
Go to the Grafana dashboard, click on + sign and click on Import.In Import via grafana.com, put the dashboard id 7587 and click on Load.Then select the Prometheus data source and click on Import.
The Prometheus Blackbox Exporter dashboard will get imported.You will be able to visualize metrics like Global Probe Duration, Status, HTTP Duration, Average Probe Duration, Average DNS Lookup, SSL Expiry, and many more.
These all are separate panels on the dashboard. Let me show the HTTP Duration panel in detail. This panel shows the visualization of time duration taken for connecting, processing, resolve, tls, and transfer requests.
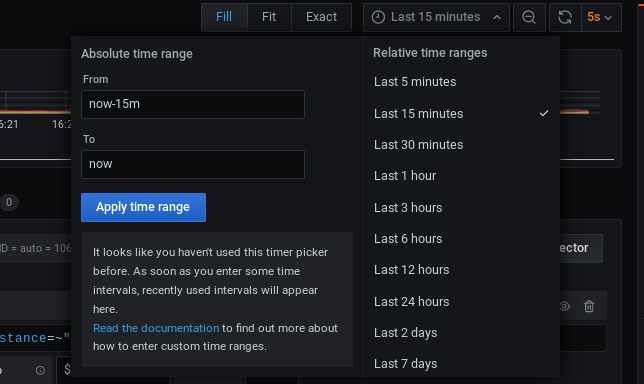
There are a lot many options on the dashboard with which you can play around. You can change the time range for which you want the visualization to appear. You can also change the time interval in data refresh; here, the new data is coming in the dashboard every 5 seconds.
When you click on the HTTP Duration down arrow, you will get the options shown below. Click on edit.
Below the visualization panel, you will get a query editor. Currently, the query shown in the below snapshot is getting visualized – probe_http_duration_seconds.
There are hundreds of queries which you can easily visualize and add it to your dashboard as per the requirement.
You have plenty of options to change the visualization type also. The average probe duration is present on the dashboard in the text format. From the visualization panel on the right, click on the Guage option for average probe duration.
And this is how the visualization will change.
Conclusion
The above is just to give you an idea of how easy it is to monitor the website with Prometheus Blackbox and Grafana. There are plenty of options, and I would strongly suggest playing around with it to experience it. If you are curious about learning Grafana, then check out his online course.