As a result, a lot of companies are adopting WordPress at present. According to statistics, 35% of the internet is powered by WordPress. It has become the online publishing platform for a majority of big companies such as CNN, Facebook, Time Inc, Spotify, Sony, Microsoft, and the list is long. But what is the secret sauce behind the tremendous popularity of this platform? Well, the reason is that WP offers an easy-to-use, customized, and multimedia supporting platform that people love to use. It supports a wide range of professional plugins that help website owners to represent their data with a visual effect that draws attention.
Why is it better to use professional WP plugins?
Adding more and useful data to your posts increases its credibility. While finding data is not difficult (thanks to the Internet), but presenting them in a way that readers find it easy to digest is the elephant in the room. Listing the statistics and figures endlessly makes it tough for readers to comprehend the message. Ultimately, they get bored! However, it works when you present data in a visual layout, for instance, tables, charts, and graphs. Now, for adding that visual effect, many people use images, default tables, or embedding charts, which is not a straightforward way. It is because this method would not work if you want to update the data. For this, you need a dynamic solution which can be covered by professional WP plugins. Fortunately, you can find a variety of awesome plugins available for simplifying the entire course of creating dynamic and great-looking visuals.
Visualizer
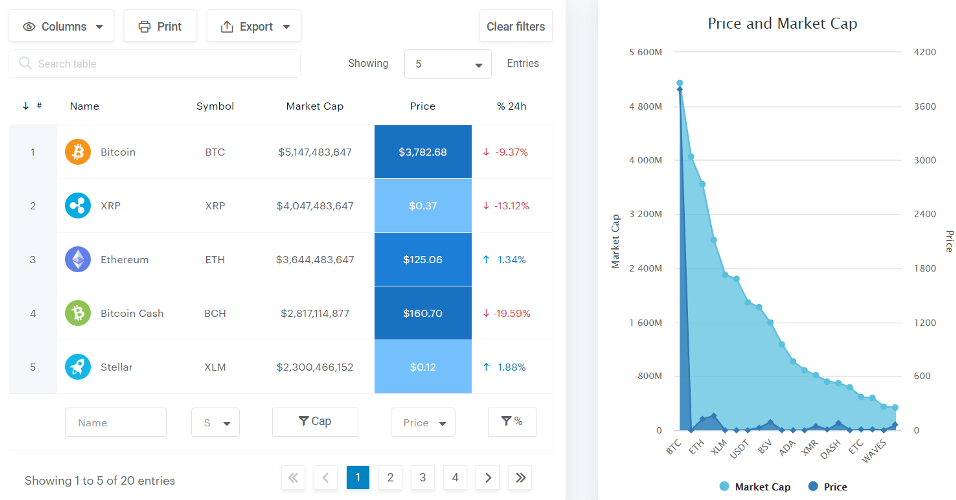
Creating interactive graphs and charts is super easy with Visualizer. It has a wide customer range of over 40,000 because it provides responsiveness and customized solution. You can add charts and tables through Visualizer Library that can be added to your WP Media Library. Enter data by importing it from a Google Spreadsheets or existing CSVs and edit it directly. It supports a large number of data types, including numbers, strings, Boolean, date, and time. Popular charts, including line, bar, and pie charts can be created and customized based on style, design, color, and behavior. You can edit your charts instantly and preview to get a glimpse in real-time.
Key Features
On-page data editing15 chart types – 6 from Charts.js and 12 from Google chartsEasy to import databaseAutomatic data synchronization by creating schedulesAnimated chartsPrivate chartsChart creation based on your WP posts, attachments, or pagesInstant searchFilter results based on textMulti-column orderingPermission feature to control viewing and editing of charts
Visualizer provides mobile portability and cross-browser compatibility.
wpDataTables
Trusted by over 30,000 businesses, the best-selling WordPress plugin wpDataTables lets you manage your data effortlessly with its easy-to-create tables, charts, and graphs. Regardless of the type of data you want to represent, this plugin can cover it all, including scientific, financial, commercial, statistical, and other data. You can create tables quickly in WP from data sources such as Excel, Google Spreadsheet, CSV, MySQL query, JSON, XML, PHP, etc. To use wpDataTables, follow these three steps:
Insert data into the table. For this, you can upload a file, input a URL, provide a MySQL query, or manually enter the data.Fine-tune the table as per your requirements such as editable, conditional formatting, responsive, etc.Save the table and then insert it in your post.
Key Features
Responsive charts and tables can be created that work fine across a variety of different devices.Quick at creating very large tables with millions of rowsAdvanced search and filters to narrow down resultsThe contents of the tables can be edited.Highlighting of cells, columns, and rows based on contentThree powerful engines render charts and can be changed in real-time.Interface language selectionTables can be hidden until fully loaded.Tables can be exported to PDF, CSV, AMD XLS functions.
WP Responsive Table
If you are looking for an affordable yet effective solution for a WP plugin, WP Responsive Table is a great solution. You can create charts using Charts.js, and it supports seven types of charts, including pie, bar, doughnut, line, radar, bootstrap progress bar, and polar chart. Data could be entered manually or can be uploaded directly through CSVs. It also provides CSV templates to let you see the way data is organized before you go on uploading them. You can horizontally scroll the HTML tables on smaller screens using this plugin. Hence, it can easily fit the screen well. To insert the charts and tables, you do not need to use shortcodes. Instead, it works great with a normal HTML table in Gutenberg or Classic Editor. This plugin offers various style settings having different options to change padding, margins, typography, colors, etc.
amCharts
Adding JavaScript Maps and Charts into a WordPress post is an invitation to annoyance. It is because WP removes all the JavaScript content. amCharts saves you from this trouble by letting you create code snippets of a chart that you can insert into your post or page in the form of a shortcode. Furthermore, you can use a PHP function in order to invoke the created chart in a template. Using this WP plugin, you do not need to include JavaScript libraries in your theme code because it will take care of it. All the JavaScript libraries that you may need would be available automatically in the page footer.
Key features
Switching between local or CDN hosted library storage for map/chartYou can set defaults based on the chart type.WPML compatible to create maps and charts that are language-specific
Data Tables Generator
Data Tables Generator by Supsystic has over 30,000 installs and can create responsive tables automatically by default. However, you can also opt to disable this feature in order to adjust table dimensions. You can enter as many rows and columns you may need in your table and can sort and filter your charts and graphs as well. Besides, you can also select background color and text and then specify horizontal and vertical alignment for them. As different kinds of data need different types of representations; this plugin offers a variety of different charts like area chart, line chart, pie chart, bar chart, column chart, and bubble chart. Using Data Table Generator, you can import your tables from Excel, CSV, and Google Sheets while export to PDF, CSV, XLS, and XLSX.
Key features
Responsive modes to optimize tablet layout to fit various screen sizesFront-end editingDatabase source to display a table with its fields from your databaseSearchSortingPagination to provide better website navigationGoogle diagrams and charts
M Chart
When you are searching for a free WP plugin, M Chart is a good alternative. It lets you present data in the form of charts through either Highcharts or Chart.js chart libraries. You can manage all the data sets through a spreadsheet interface, and you can embed the charts via a shortcode in your post. This data renders the following chart: Using the “general settings” under “M Chart Settings,” you can decide whether you can preview the charts or not and whether you are allowed for remote embedding. It offers you four types of charts, namely, line chart, bar chart, pie chart, and column chart. To add data into a chart, you can enter it manually or upload using CSV files and then use it in your post through shortcodes. It also gives you the option to export chart values to CSVs, which is an evident feature missing from most chart plugins.
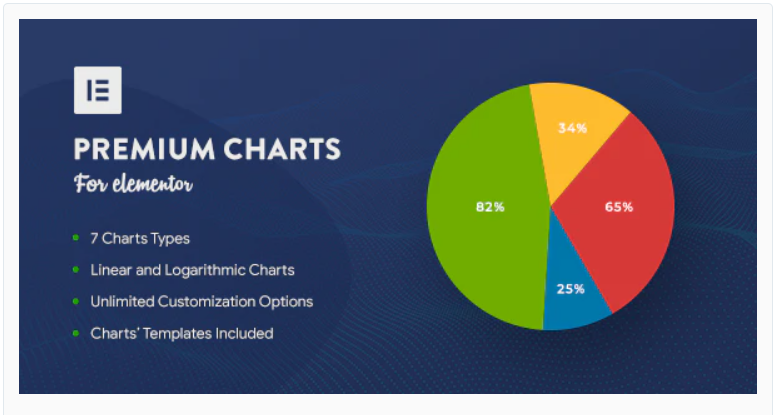
Premium Charts for Elementor
Create splendid charts and graphs effortlessly in the Elementor Page Builder using Premium Charts for Elementor. It claims to be the first sophisticated Elementor widget to help you in creating charts with several customization options. This plugin supports seven different types of charts. These chart types take various data sets, and everything happens inside the Elementor, where you can see the data is rendered live. You can create linear as well as logarithmic charts using this tool. However, it offers a default linear scale, but you can change it to logarithmic if required. Through powerful customization, you can present data elegantly to match the color scheme of your website.
UberChart
The advanced WP plugin with excellent customization, UberChart lets you create charts of different varieties. It offers 240 options for each chart and 30 options for each data set in order to create charts tailored to your specific requirements. The plugin supports ten chart types. After selecting one among them, you can customize it with a multitude of options available. It offers general customization options to define a chart’s general behavior such as setting the size, background color, and margin, whether you want chart responsiveness or not, type and speed of animation, title and legend behavior, tooltip style, etc. You can also customize each data set to enhance the appearance of your chart by deciding things like defining curve tension, line width, creating dashed lines having custom gaps, setting point style, radius, and background color, and many more. UberChart lets you choose different scale types such as linear, logarithmic, time, and category. Also, it offers multiple axes to plot datasets on a secondary axis in case values differ widely. You can also choose whether you want stacked data or not, move scale positions, hide scales, customize grid lines, etc. Using the spreadsheet editor, you can copy data to UberChart from an online spreadsheet such as Google Sheets, MS Excel, etc. and vice versa. You can also add data easily and drag rows and columns. The import and export option is also available to backup your charts in the form of XML files.
Conclusion
Adding relevant and useful data enhances the credibility of a post. Most importantly, representing those data in a manner that readers can digest is the real goal. Thanks to modern WP plugins for creating tables, charts, and graphs; they make your data comprehensive by adding a visual effect that connects with your audience well.